LogoTenancy
Commercial office district skyline at golden hour with glass towers catching late afternoon light
Commercial Office Management

Your building is losing $14.60 per square foot.
We find it.

Free NOI gap analysis · No obligation · Response within 24 hours

Scroll
97
Occupancy Performance
0.0%
Average occupancy across all managed Class A properties — 11.2 points above the national average.
0M sq ft
Under Management
0.0%
Renewal Lift per Satisfaction Point
0 yrs
Avg. Anchor Tenant Tenure
"The number isn't the story."

At 97.3%, we're operating in territory most property managers never see. The national office vacancy rate hit 19.4% in 2024. We're running the other direction — not because we're lucky, but because every system in every building we touch is calibrated to make leaving feel like a mistake.

When 63% of occupiers are planning to reduce their real estate footprint, the buildings that retain tenants are the ones where the HVAC never makes the agenda at board meetings.

TENANCY PORTFOLIO97.3%
NATIONAL AVERAGE80.6%

Source: CBRE 2024 Office Market Report · Tenancy internal portfolio data

Operational Precision

The invisible work that
keeps tenants renewing.

80% of tenant-facing interactions are with maintenance personnel. We treat that as a retention strategy, not a cost center.

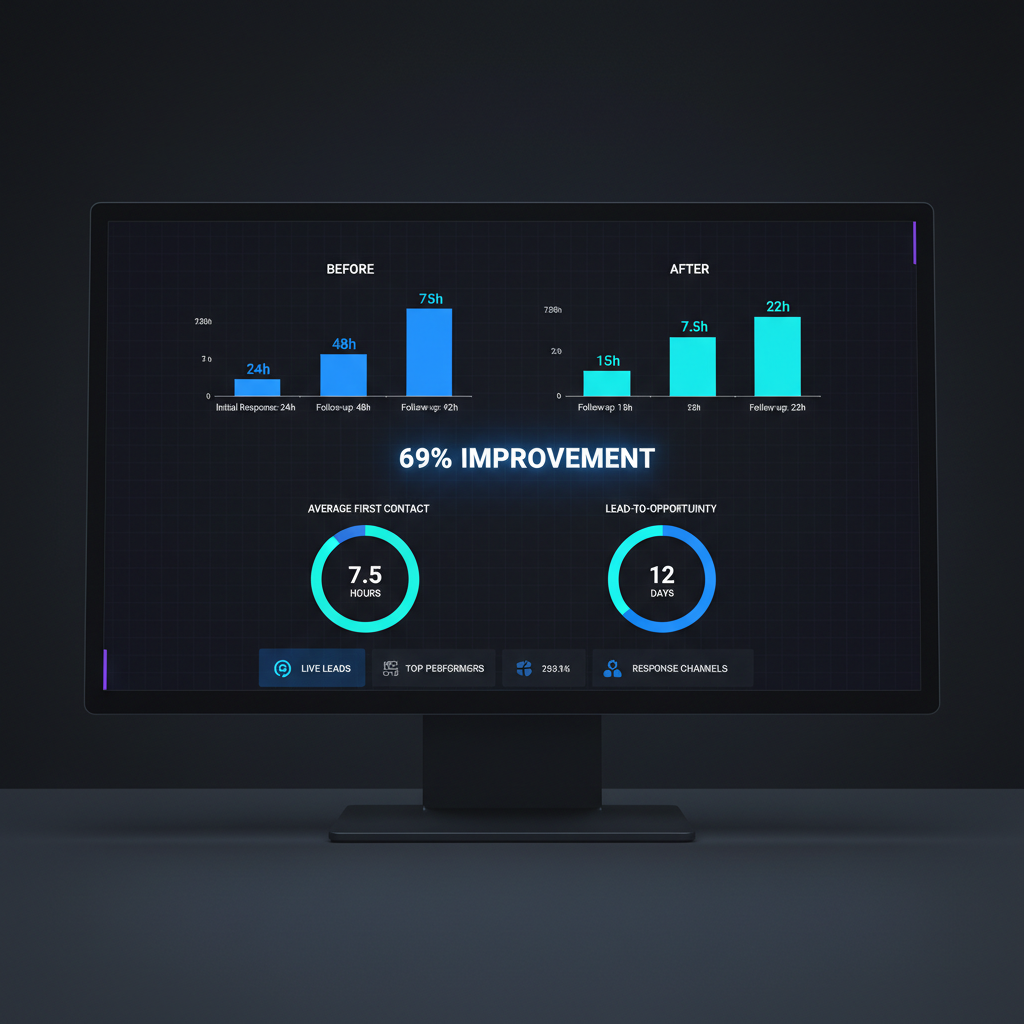
23min
Average Maintenance Response Time
Across all service categories — HVAC, electrical, plumbing, air quality. Tracked per building, reviewed weekly.
87%
Tenant Retention Rate, Year 3+
MIT CRE research confirms: each 1-point satisfaction increase lifts renewal likelihood by 8.6%. We measure both.
18%
Average Energy Cost Reduction
Advanced HVAC controls, LED retrofit programs, and water-efficiency upgrades across the managed portfolio.
70%
Correlation: Staff Quality → Tenant Satisfaction
Grace Hill/Kingsley data. Physical attributes score only 42%. We hire for the other 58%.
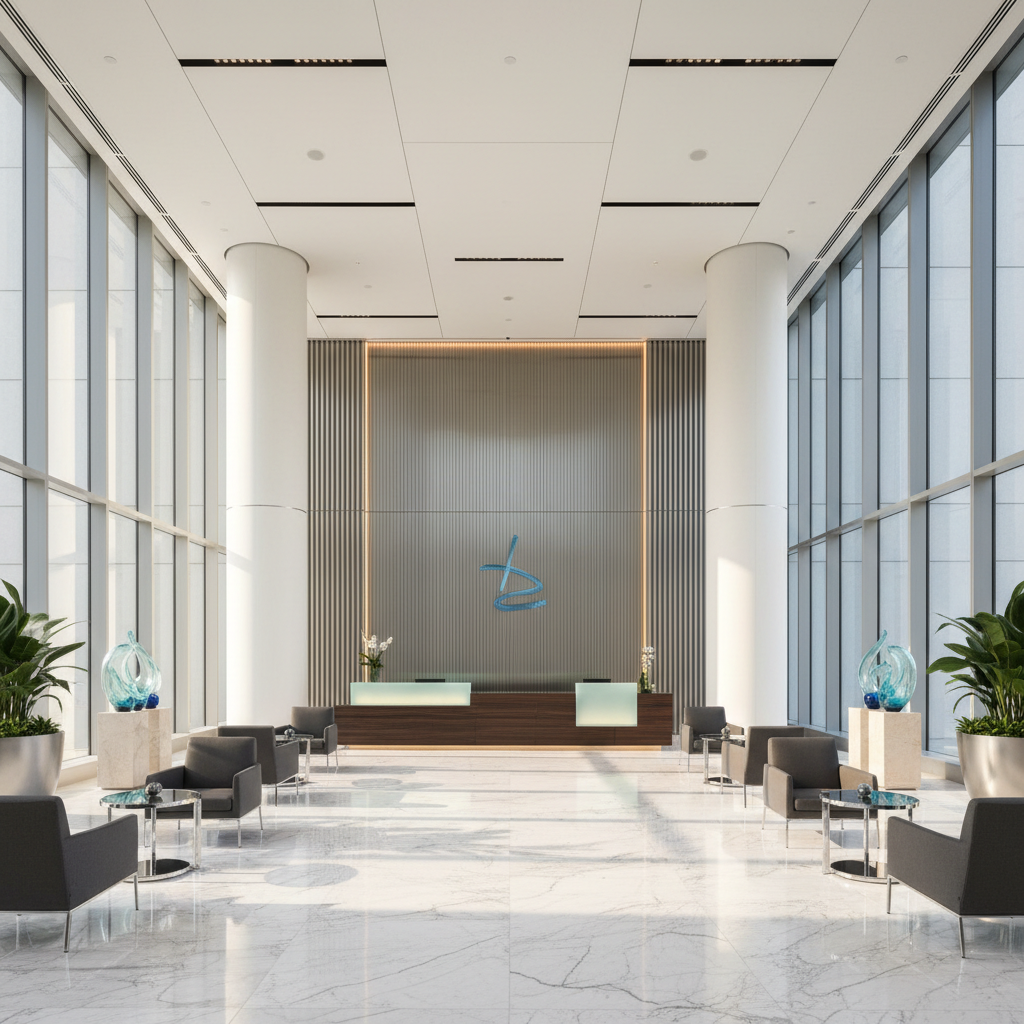
Modern Class A office building lobby with marble floors and high ceilings showing premium property management
1221 Avenue Tower · New York
2.1M sq ft · 97.8% occupied
The People Behind the Numbers
2 a.m.
Marcus Webb, Chief Engineer, 1221 Avenue Tower at Tenancy property management
Marcus Webb
Chief Engineer, 1221 Avenue Tower
"The chilled water reroute at 2 a.m. meant 340 tenants arrived Tuesday morning to a 72°F floor. The building manager never got a call."
When the call came in · New York, NY
10 yr
Diane Forsythe, Senior Leasing Coordinator at Tenancy property management
Diane Forsythe
Senior Leasing Coordinator
"The prospect tour was 45 minutes. I showed them the engineering logs, the energy dashboards, the response history. They signed a 10-year anchor lease."
Anchor lease closed · Chicago, IL

Institutional Clients Include

Blackstone Real EstateNuveen OfficeBrookfield PropertiesOxford Capital
Financial Outcomes

The case builds itself.
Every number is verifiable.

We don't ask you to trust us. We show you the data — from CBRE, MIT, Cushman & Wakefield, and our own managed portfolio — and let the arithmetic speak.

$14.60/sqft
NOI Gap in Underperforming Class A

The delta between a Tenancy-managed tower and the Class A average of $42.39/sqft asking rent — recoverable through occupancy lift, tenant retention, and energy optimization.

CBRE 2024 Office Market Data · Tenancy Internal Analysis
$31.9K
Average Turnover Cost Per Departing Tenant

Replacement costs run three times higher than retention costs. Every tenant we keep is a line item saved — and a relationship deepened.

Industry Benchmark 2024 · Cushman & Wakefield
2.4%
Effective Rent Increase, Prime Class A (2023–2025)

While Class B/C rents fell 1.2%, top-tier buildings with premium management saw rents rise. The divergence rewards operational excellence.

CBRE Analysis of 3,900 Lease Transactions
217M sqft
Office Leases Expiring 2024–2025

The renewal window is open. Buildings with documented operational performance win the re-sign before competitors finish their proposals.

CRED iQ Research · Q3 2024
14–30%
OpEx Reduction via Sustainable Systems

Advanced HVAC, LED lighting, and water-efficiency programs cut operating expenses — directly expanding NOI without raising rents.

MIT Center for Real Estate · BOMA International
49M sqft
Net Absorption, Prime Class A (2020–2024)

While non-prime lost 170M sqft of tenants, Class A gained. The flight to quality is structural — Tenancy positions your asset to capture it.

CBRE Flight-to-Quality Analysis

Ready to close your NOI gap?

We'll identify the specific leakage in your building — free of charge.

Book Your Review

Schedule a
Building Review.

We'll walk your property, benchmark it against our portfolio, and show you exactly where the NOI gap lives — in writing, within 5 business days. No pitch deck. Just data.

We'll confirm within 4 business hours. No spam, ever.

Free Resource

2024 Office NOI
Benchmark Report

Our proprietary analysis of 43M sq ft under management — occupancy performance, energy cost benchmarks, tenant retention rates, and per-market NOI comparisons. 28 pages. Cited by three institutional asset managers at Q4 board meetings.

Market-by-market occupancy benchmarks
Energy OpEx reduction case studies
Tenant retention cost model
Q1 2025 rent trajectory by tier
🔒
Confidential
All building data shared with us stays strictly private.
📊
No Obligation
The review is free. We earn your trust before your contract.
24-Hour Turnaround
Initial NOI gap assessment delivered within one business day.